IDIOM is an advanced analytics platform which integrates
multiple sources of behavioral data combined with multiple
digital media sources and third party partners to create
anonymized data sets.
Complexity
IDIOMs data sets can then be used to create granular
behavior-based segmentations for use by data scientists to help
guide campaign planning. It is among the most complex and
difficult products i have had the opportunity to work on and
definitely one of the most interesting.
The
technical challenges combined with the need to design with data
made this a wonderful challenge to create the user experience
for.
It needed to provide insights and multiple
stages, be user friendly and intuitive as well as be able to be
modularized for additional expansion.
Challenge
With traditional sites or web app you generally have a fixed set
of data, or at least know the type of data that you will be
seeing and when. This makes creating a web structure relatively
straight forward, you find the data, organize it, and then find
the optimal way to get that to the user.
But how do you do this with unknown data that is constantly
changing each time the user opens the app. One type of data may
be there, the other might have changed, and another might be
based on a combination of the two.
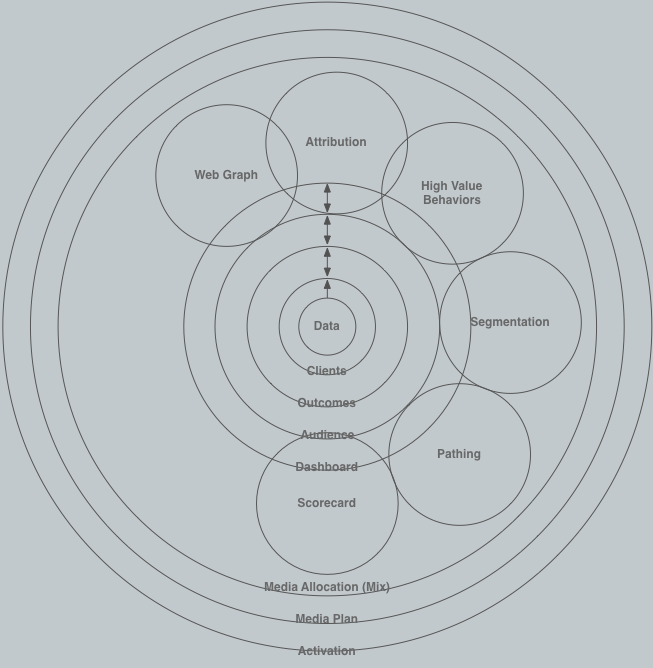
Instead of a traditional sitemap we developed a type of orbital
navigation, there are a few key advantages to this.
LAYERS
With orbital navigation you are aware that any layer larger
than the central one is reliant on this data.
MODELS
Sections which are overlapping require both models at the
same time to generate data
INDEPENDANT
Sections on the same level are able to be viewed
independently of each other
HIERARCHY
Sections are available at each level past the one they were
first available
There are of course other ways to visualize this hierarchy and
interdependency, however doing so for each possible permutation
of the data set, and predicting ones that have not yet occurred
make it a very difficult and time consuming task to maintain.
With the orbital navigation we are able to at a quick glance
know what data is available, when it is presented, and when it
is required.
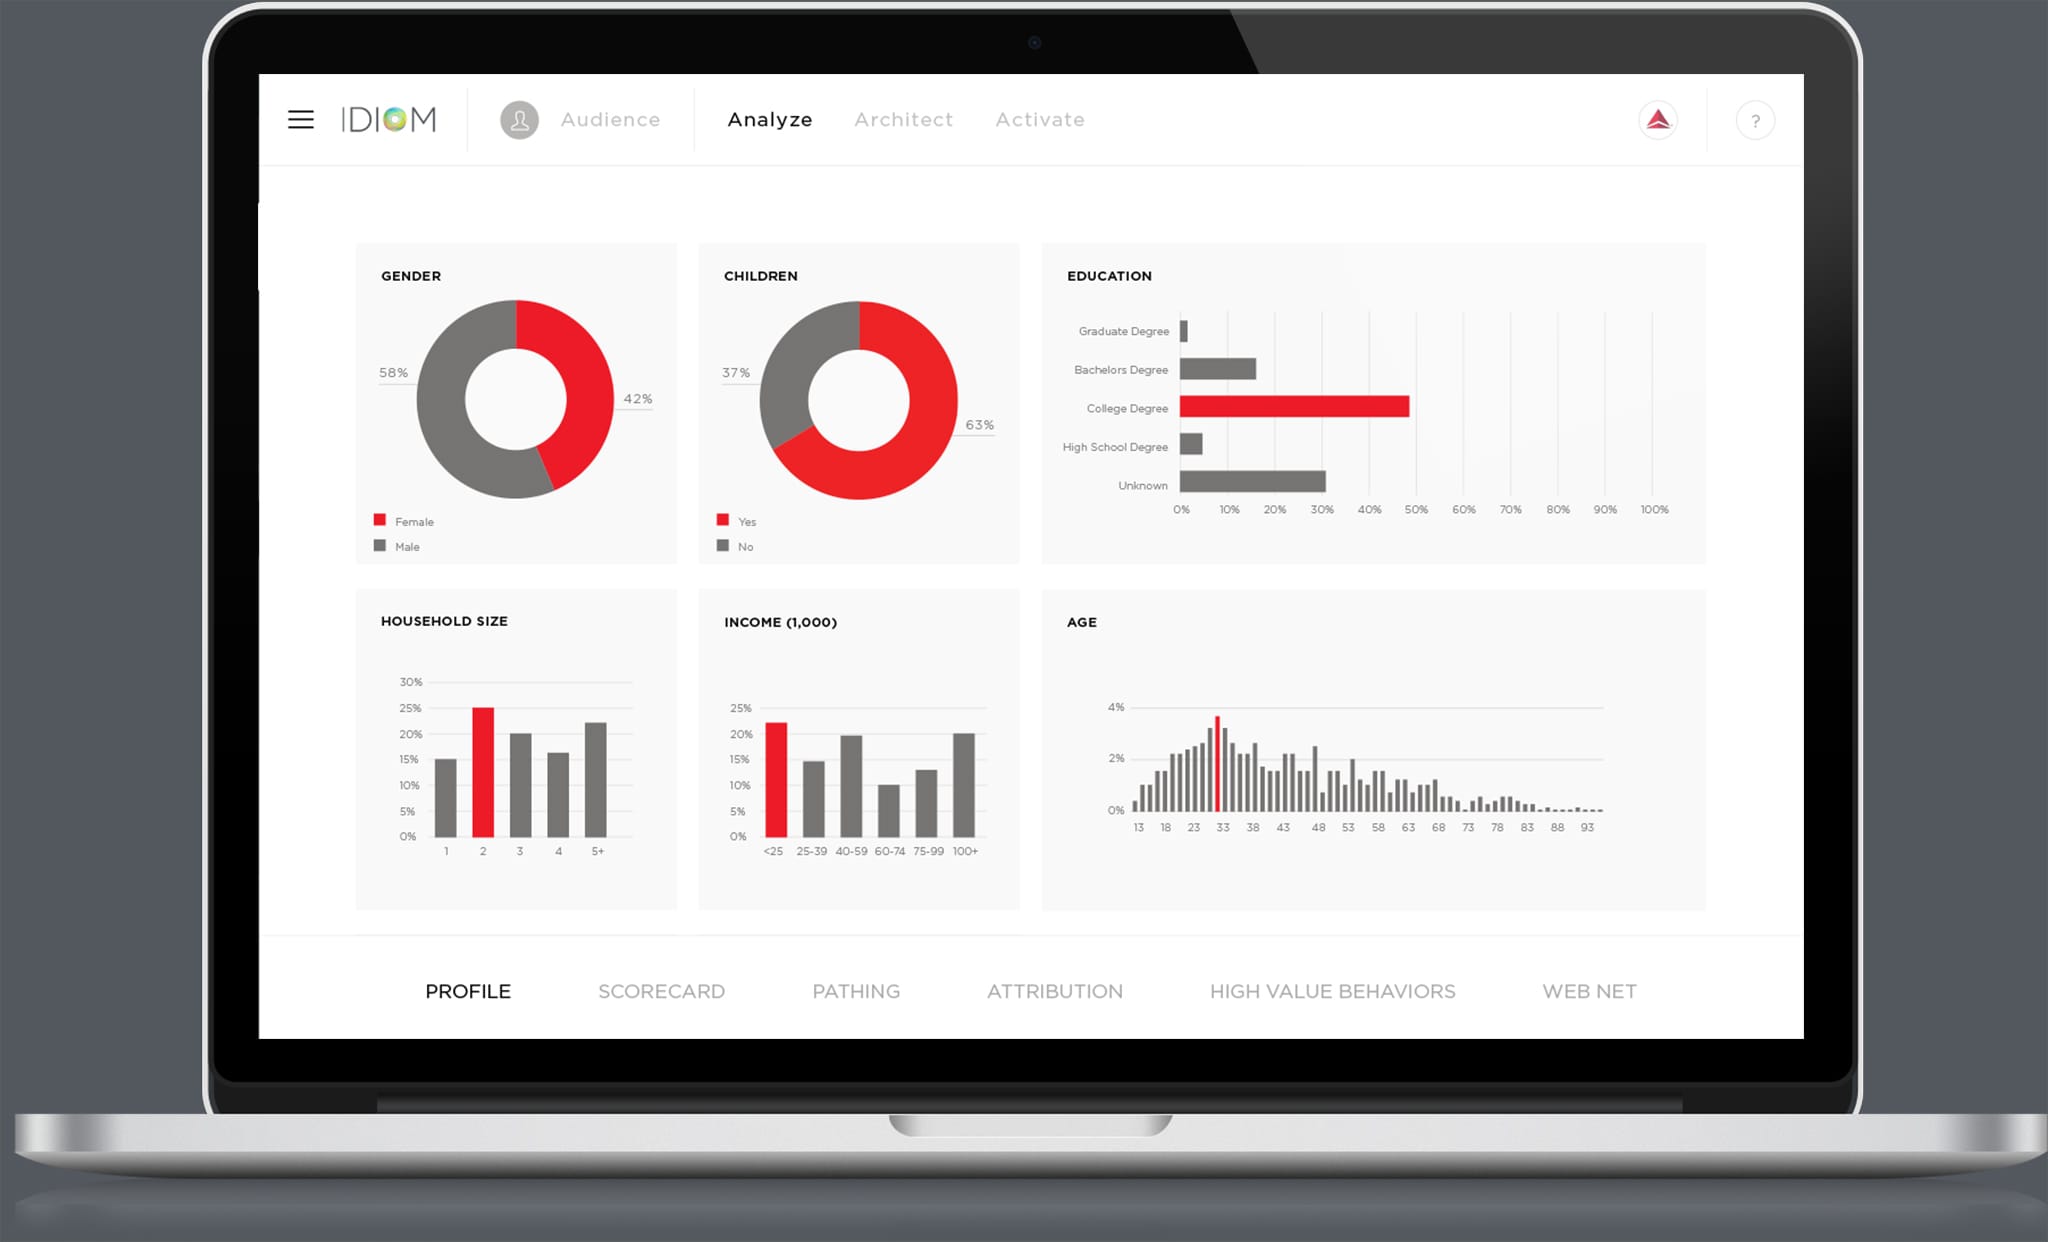
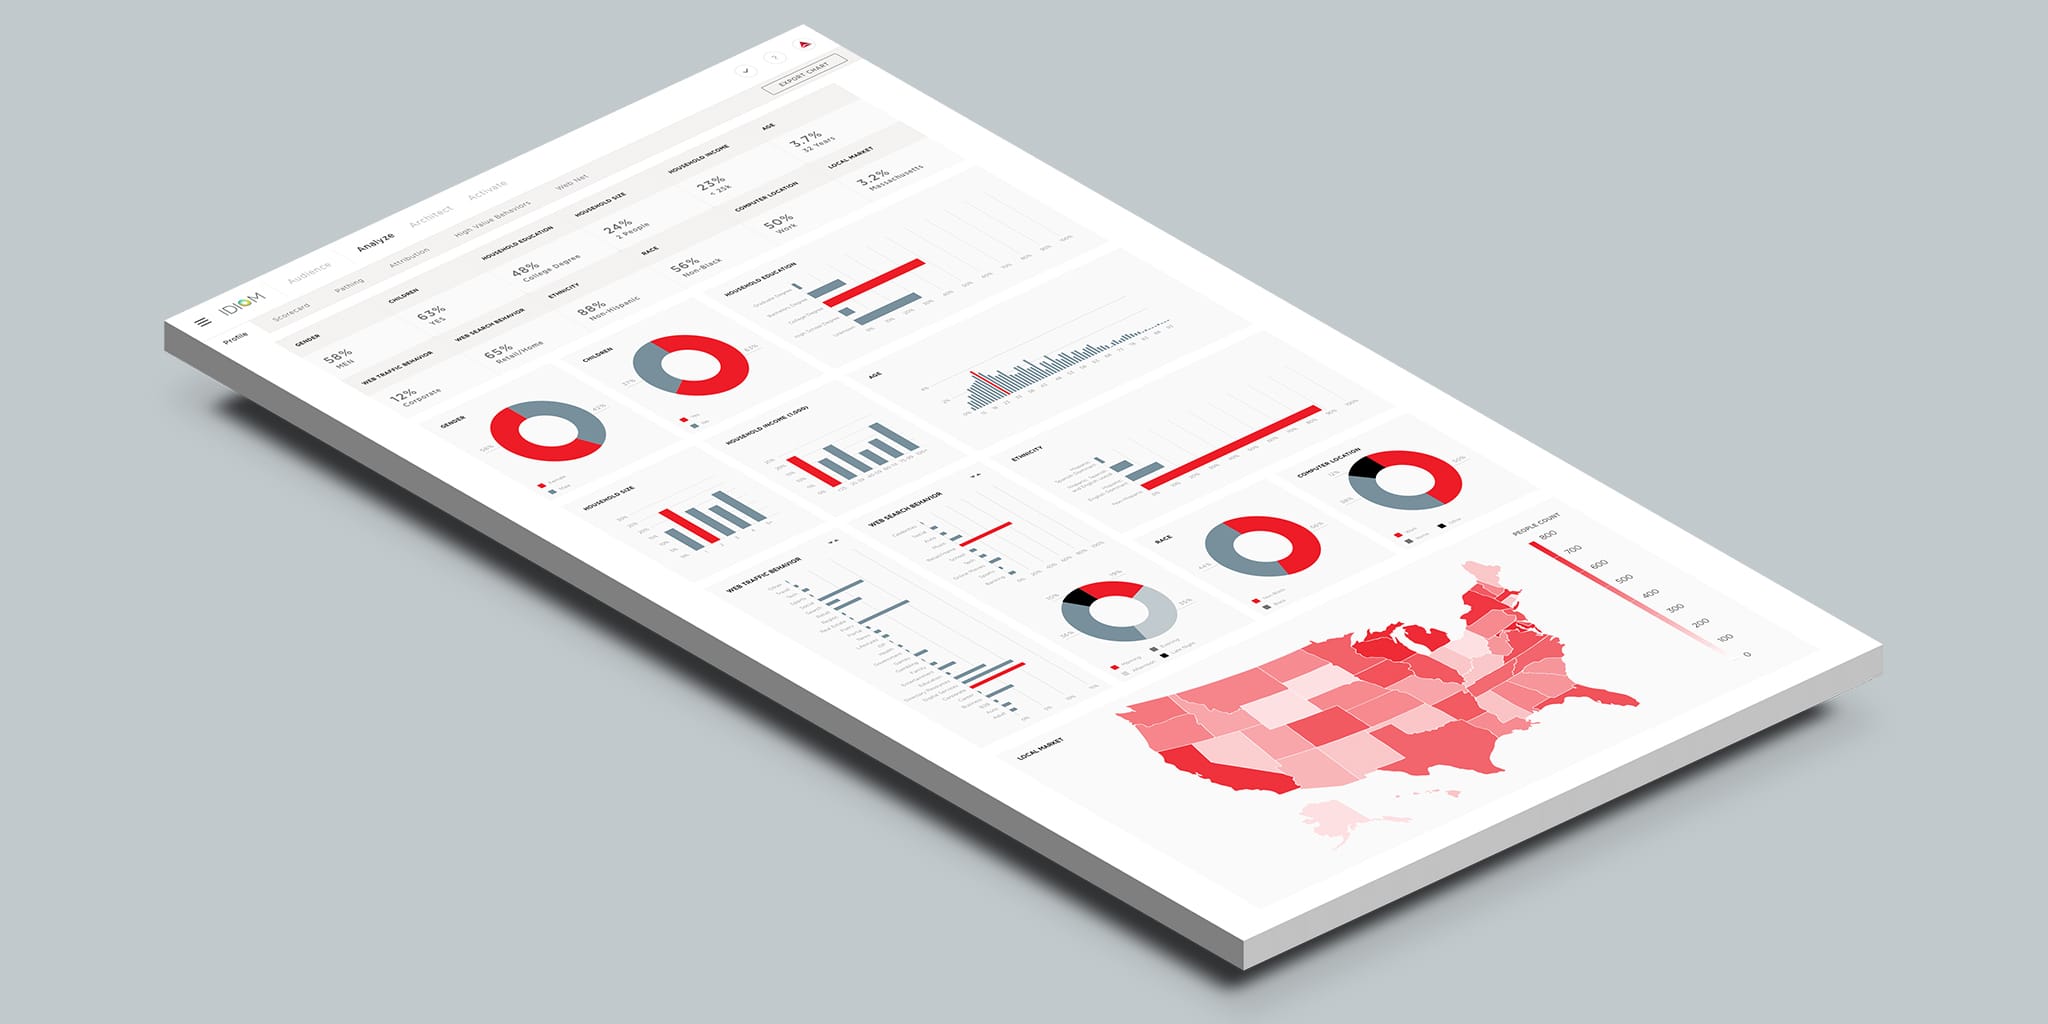
Designing with Data
On each project when possible i prefer to work with the actual
data that will be presented, this not only helps to get a better
understanding of what the end product will be, but the optimal
way to provide this information to the end user.
In the case of IDIOM we worked closely together with the Data
Scientists and were able to get the outputs of the statistical
models at each stage of the modeling process. This meant that we
could see how the data would be potentially changing over time
and give us a good idea for how to present it to the user.
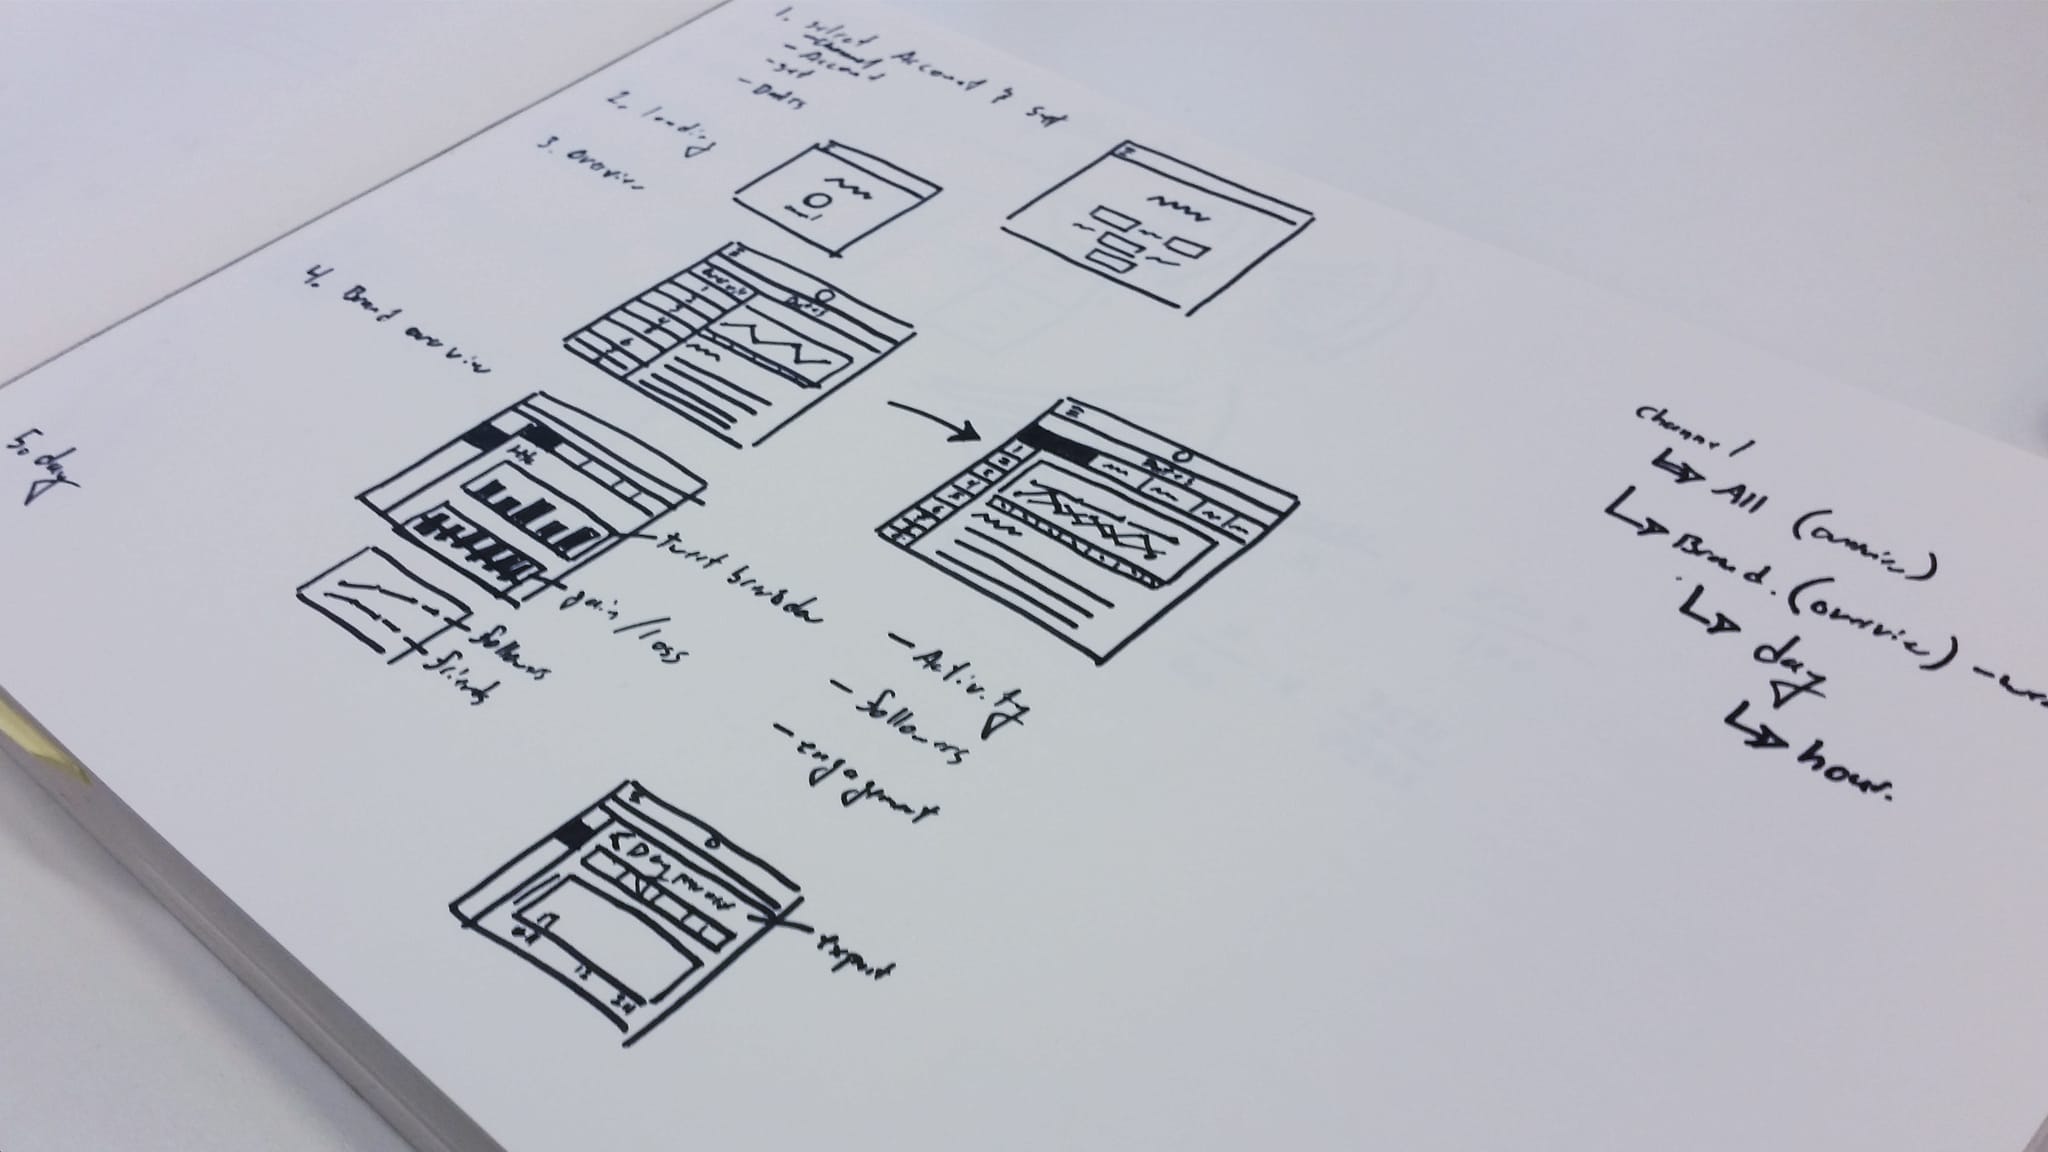
There were a few very key points in the project when new models
were discovered that reshaped the entire user experience and
design of the tool. If we had not been designing with data, and
instead focusing on the assumptions we had at the beginning of
the project, the usefulness and user experience of the tool
would not be where it is today.
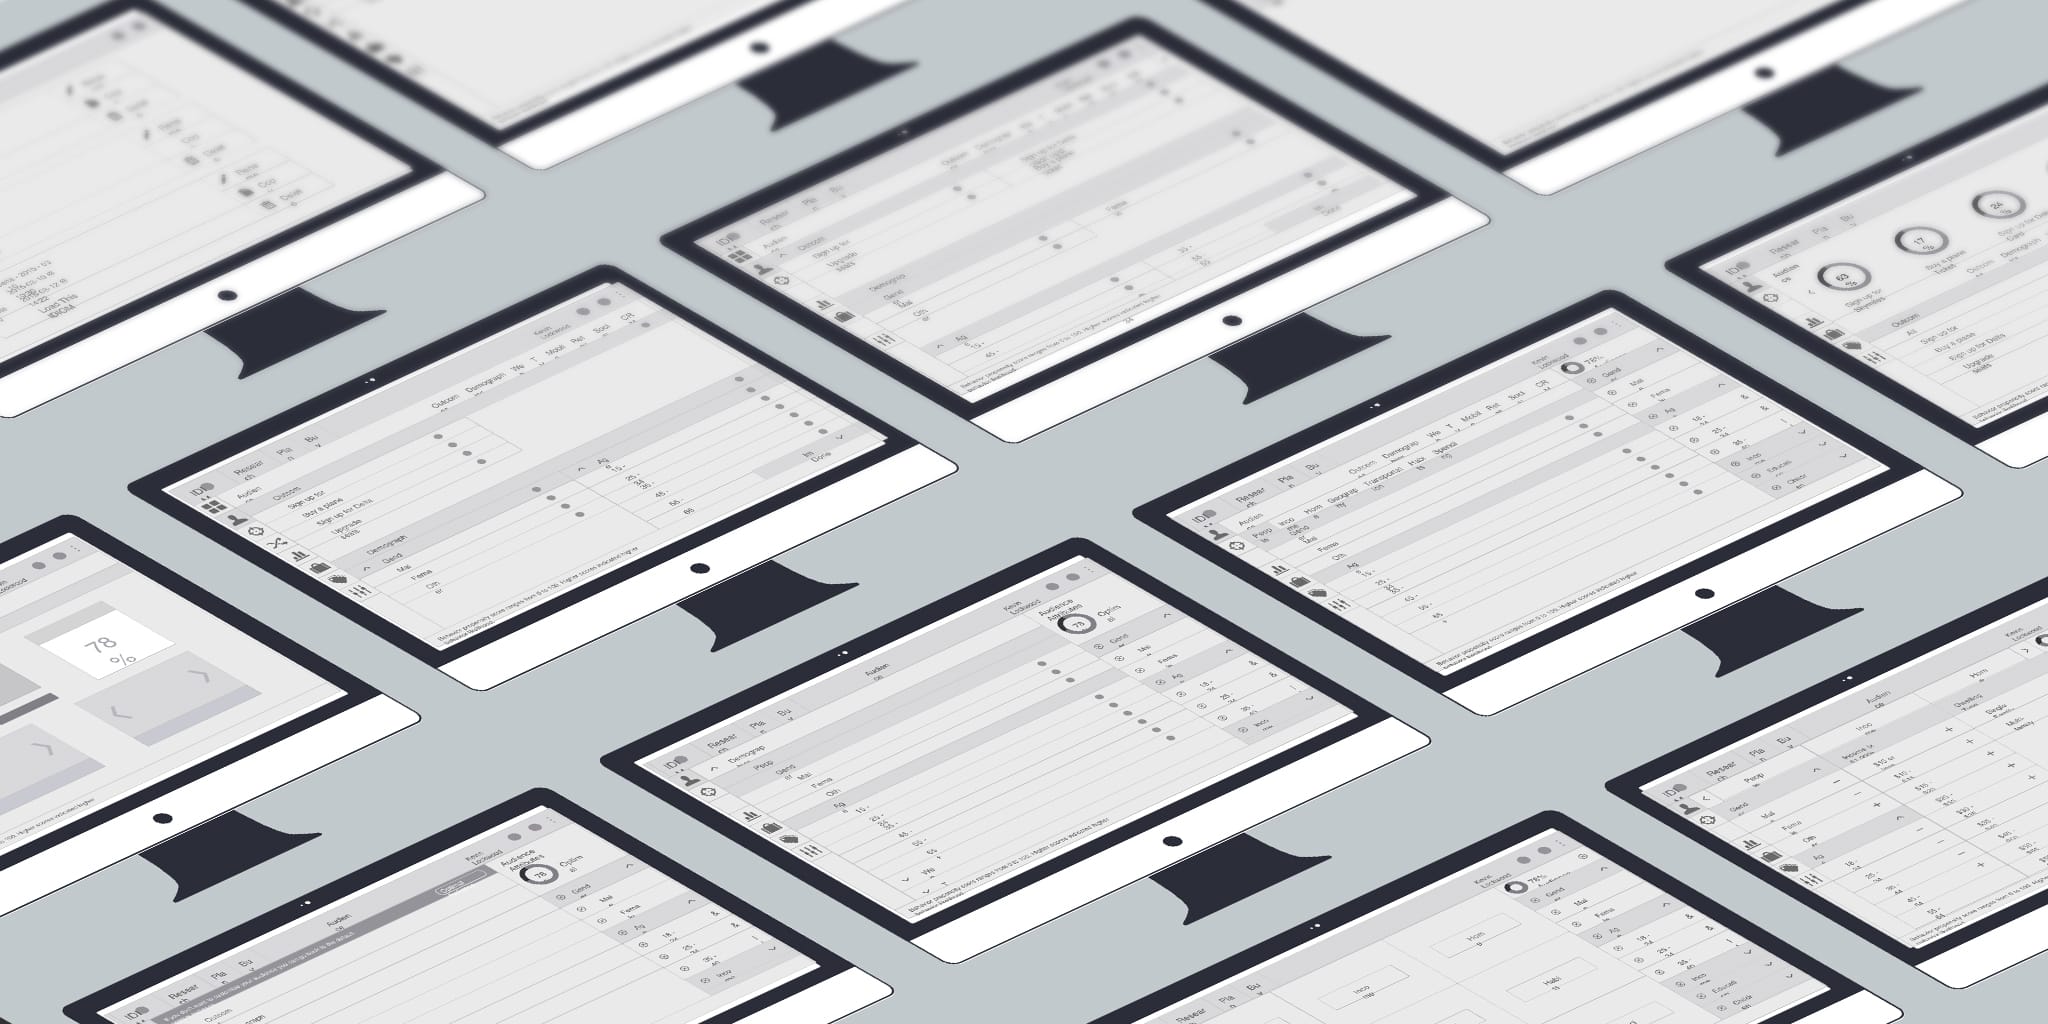
Mixed Disciplines
In order to focus on all aspects of the tool and to be able to
work in an efficient agile manner the experience design team was
split into focus groups. Each team member had an understanding
of each discipline but primarily focused on either experience,
design, data.
This meant that each of us could go and take over another role
and update the Sketch files with new assets, or manipulate the
data to see what we could do, or take another look at the
overall journeys.
Working in this way ensured that no aspect of the tool was
overlooked while still keeping the amount of people involved to
a minimum, in addition to this each aspect was looked at with
fresh eyes to flag any potential issues.
Project Launch
The ability for the various team members and disciplines to come
together, have morning standups and tackle the next issue that
needed addressing meant that we were able to quickly build out
an MVP and later a full fledged tool within a matter of months.
Although this was one of the most difficult projects i have ever
worked on, the team members commitment, skills and knowledge
meant that we were able to create something incredible and i am
very thankful to each and every one of them.
Thanks to everyones hard work the project is currently active
and in use by various teams and is helping to provide richer and
more insightful analytics.